
January 04 , 2020 .
Alaska , Shishaldin :
AVO/USGS Volcanic Activity Notice
Current Volcano Alert Level: WATCH
Current Aviation Color Code: ORANGE
Issued: Friday, January 3, 2020, 11:38 AM AKST
Source: Alaska Volcano Observatory
Notice Number: 2020/A1
Location: N 54 deg 45 min W 163 deg 58 min
Elevation: 9373 ft (2857 m)
Area: Aleutians
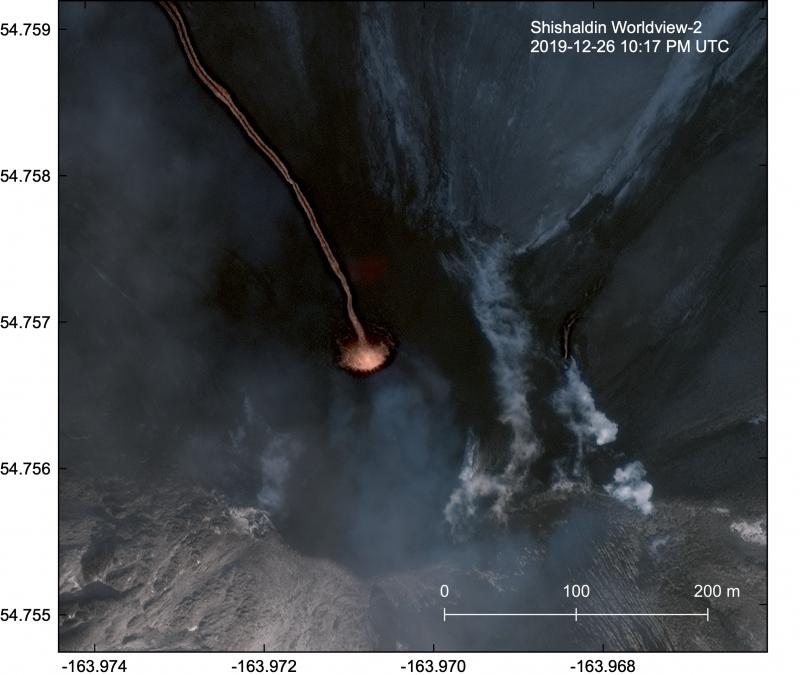
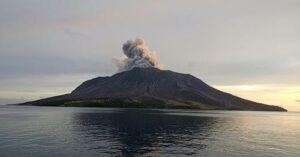
Satellite image of Shishaldin from December 26, 2019. Tephra deposits blanket the upper slopes of the volcano, while a long lava flow extends almost 1.5 km to the NW and a second small lava flow extends ~100 m to the NE.
Volcanic Activity Summary:
Eruptive activity occurring at Shishaldin Volcano. Activity this morning has produced an ash cloud to 20,000 – 24,000 feet that is moving to the E-SE. The level of seismic activity has increased to moderate levels and several pilot observations of ash clouds have been reported to AVO. The ash cloud is visible in satellite data and extends 15-20 miles beyond the volcano to the southeast. Shishaldin remains at Aviation Color Code ORANGE and Alert Level WATCH. The National Weather Service has issued SIGMET to 24,000 ft above sea level (https://www.weather.gov/aawu/).
Shishadin remains at a heightened level of unrest and explosions may occur with little warning.
Shishaldin is monitored by local seismic and infrasound sensors, satellite data, a web camera, a telemetered geodetic network, and distant infrasound and lightning networks.
Recent Observations:
[Volcanic cloud height] 24,000
[Other volcanic cloud information] Unknown
Remarks:
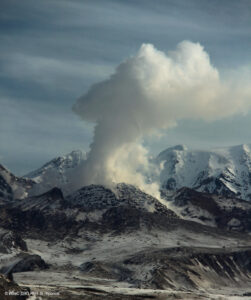
Shishaldin volcano, located near the center of Unimak Island in the eastern Aleutian Islands, is a spectacular symmetric cone with a base diameter of approximately 16 km (10 mi). A 200-m-wide (660 ft) funnel-shaped summit crater typically emits a steam plume and occasional small amounts of ash. Shishaldin is one of the most active volcanoes in the Aleutian volcanic arc, with at least 54 episodes of unrest including over 24 confirmed eruptions since 1775. Most eruptions are relatively small, although the April-May 1999 event generated an ash column that reached 45,000 ft above sea level.
The eruption of Shishaldin Volcano that began in late July, 2019 continues with short duration explosive activity from the summit crater and effusion of lava flows on the upper flanks of the volcano. This morning, beginning about 9:30 AKST, seismicity at the volcano began increasing over a period of several hours and eventually led to a brief period of sustained ash emission resulting in an ash cloud that reached as high as 27,000 feet above sea level according to reports from passing pilots. The ash cloud consisted of a linear, directed ash plume that extended from the volcano to the southeast at least 75 miles. The ash cloud also produced minor amounts of volcanic lightning. Seismicity has abruptly decreased and for now there appears to be no sign of continued ash emission. Satellite images of the volcano obtained throughout the week showed consistently elevated surface temperatures indicating continued effusion of lava.
Source : AVO.
Photos : Loewen, Matt , Schaefer, Janet .
La Réunion , Piton de la Fournaise :
Seismicity
In December 2019, the OVPF recorded at Piton de La Fournaise: 25 shallow volcano-tectonic earthquakes (0 to 2 km depth) below the summit craters; 4 deep earthquakes (>2 km depth); 270 rockfalls (inside the Cratère Dolomieu or along the cliff of the Enclos Fouqué caldera).

The seismic activity at Piton de la Fournaise in December 2019 was low with a mean of less than one shallow volcano-tectonic earthquake per day that were located below the summit craters . Furthermore, four deep earthquakes were recorded, two of which have been localized below the eastern flank .
Deformation
Since mid-November, no important surface deformation had been detected by OVPF’s ground deformation network, a trend that continued throughout the first three weeks of December. However, edifice inflation resumed and is being recorded since the last week of December.

Record of ground deformation over the course of Decem be r 2019 . The time series plot s show the changes in distance between pairs of GP S stations crossing the Dolomieu crater (reference: SNEG; top) , the terminal cone (reference: FJAG; middle) and the Enclos Fouqué caldera (reference: PRAG; bottom) , from north to south (see location in Figure 5). Increasing distances (or baseline elongation) indicate volcano inflation, while decreasing distances (or baseline contraction) reflect an edifice deflation (© OVPF – IPGP ).
Summary .
The month of December 2019 was marked by low seismic activity below the summit craters and no significant summit deformation was observed during the first three weeks of the month. However, the resumption of edifice inflation during the last week of December, associated with increasing soil CO2 flux in the far field, is indicative of an overall resumption of the shallow magma reservoir pressurization (located between 1.5 and 2.5 km deep) due to its refilling by deeper magmatic fluids.
Source : OVPF.
Read the whole article : http://www.ipgp.fr/sites/default/files/ovpf_20200102_bullmensu.pdf
Italy , Campi Flegrei :
Weekly Bulletin, December 24, 2019 – December 31, 2019 2019
(Updated December 31, 2019 at 12:00 p.m. local time).
ACTIVITY STATUS:
In light of the monitoring data:
1) Seismology: This last week, the Campi Flegrei recorded 2 earthquakes of low amplitude (Mdmax = 0.2).
2) Deformation: The average value of the uplift of approximately 0.7 cm / month since July 2017 in the zone of maximum deformation seems to show a slight increase in speed which will be evaluated in the coming weeks. The lift recorded at the RITE GPS station is approximately 58.5 cm since January 2011.
3) Geochemistry: The flow of CO2 from the ground measured last week showed no significant change compared to the previous period, which confirms the persistence of the long-term trend; last week, the average temperature value of the main fumarole of Pisciarelli was around 113 ° C.
Seismology:
During the past seven days in the Campi Flegrei, 2 small magnitude earthquakes (Mdmax = 0.2) have been recorded. It was possible to determine the parameters of the hypocentres of the two recorded events.
Source : INGV.
Read the whole article : http://www.ov.ingv.it/ov/bollettini-campi-flegrei/Bollettino_Flegrei_2019_12_31.pdf
Chile : Nevados of Chillan :
Volcanic Activity Report (RAV) Volcanological Observatory of the South Andes – Ovdas, Ñuble region.
Seismic activity:
In the past 24 hours, the instrumental monitoring network of the Volcanic Complex has recorded volcano-tectonic (VT) and long period (LP) seismicity, releasing seismic energy at low to moderate levels.
Observations:
The highest energy earthquake VT was located 3.8 km south-south-east (SSE) of the active crater, at a depth of 3.7 km.

Observations:
The production of passive gas emissions is recorded in certain sectors of the active crater.
Other comments:
The MIROVA group (3) did not report any thermal anomalies associated with the volcanic complex.
The infrasound sensors did not record signals associated with the explosions.
The network of GNSS stations which measures the deformation of the Volcanic Complex, continues to record an inflationary process, highlighted by the lengthening of the control lines which cross the active crater and by the elevation of the 5 monitoring stations. The highest vertical rise is recorded at the station located 1.5 km west of the active crater, accumulating 11.0 cm at a rate of 1.8 ± 0.3 cm / month during the last 30 days . Control line elongation rates show a maximum rate of 1.37 ± 0.06 cm / month for the past 30 days, accumulating an elongation of approximately 6.5 cm.
Source : Sernageomin .

No comment yet, add your voice below!